🔴 Turning Point Alert: Day 8 All-Bear — Five Red Closes and Every Escape Route Widens Again as AI-Debt Fear and $111 Oil Sink the Chips — October 22, 2026

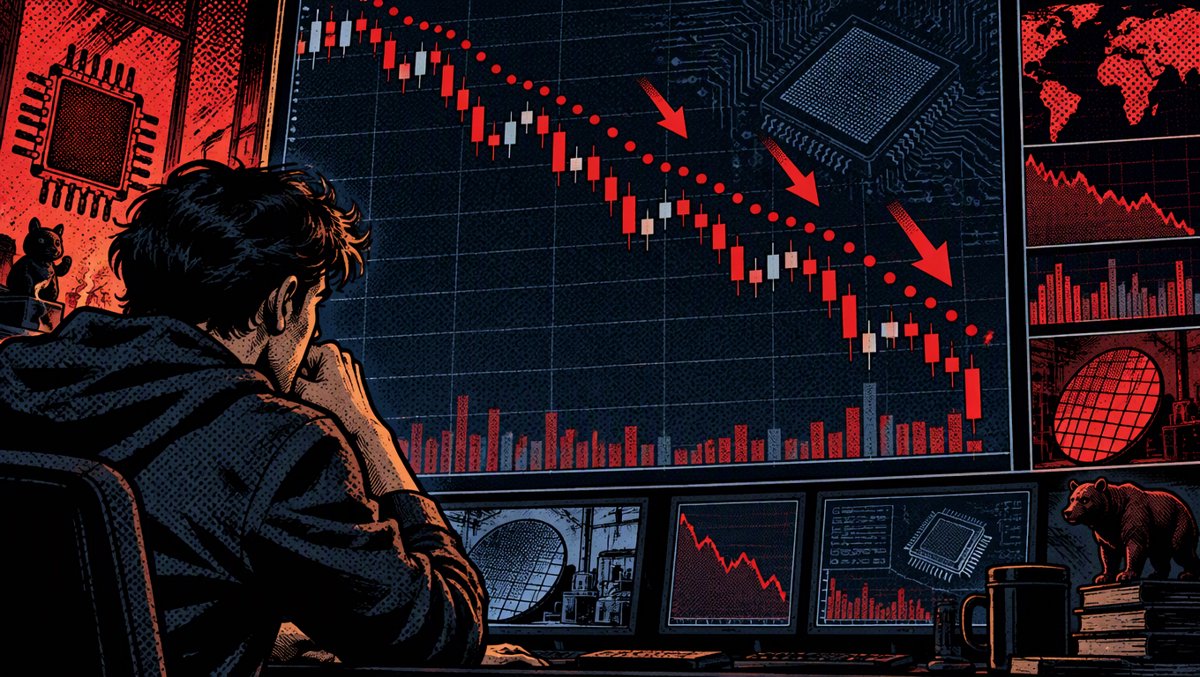
🔴 Turning Point Alert: Day 8 All-Bear — Five Red Closes and Every Escape Route Widens Again as AI-Debt Fear and $111 Oil Sink the Chips — October 22, 2026
Market Snapshot — October 22, 2026 (4:15 PM ET, post-close)
| Index | Level | Change |
|---|---|---|
| S&P 500 | 7,663.43 | −1.21% |
| NASDAQ | 26,008.86 | −2.60% |
| Dow Jones | 52,867.98 | +0.02% |
| VIX | 19.07 | +14.33% |
The Nasdaq took the heaviest hit in weeks while the Dow closed flat — a classic risk-off rotation inside the index complex. The trigger list was long: Meta's post-earnings rout spilled across the AI complex after its Q3 showed free cash flow turning negative and capex guidance lifted yet again; reports of planned U.S.–Israel strikes on Iran sent oil above $111 and Houthi attacks on Saudi Arabia put the whole Gulf on alert; and the "AI debt" conversation got louder as Oracle, Nebius's $3.5B loan, and CoreWeave all drew scrutiny on debt-funded AI infrastructure spending. Nvidia's Jensen Huang kept telling investors memory and neocloud demand isn't easing — but the tape wasn't listening. Gold retraced its entire summer rally to test $4,000/oz and silver settled at its lowest close since November 2025, with Asian markets already deep red overnight (KOSPI −3.52%, Hang Seng −3.03%, Nikkei −2.65%). Semiconductors led the decline: all five of our names closed down 4.3% to 8.1% on volume.
📊 Parabolic SAR Dashboard
Data as of October 22, 2026, 4:15 PM ET post-close | SAR(0.02, 0.20) — matches Futu/Niuniu app
| Stock | Price | Change | SAR | Signal | Days | Flip Price | Flip % |
|---|---|---|---|---|---|---|---|
| NVDA 🔴 | $212.21 | −4.40% | $233.35 | BEARISH | Day 8 | $233.35 | +9.96% |
| MU 🔴 | $856.49 | −6.26% | $985.51 | BEARISH | Day 12 | $985.51 | +15.06% |
| AMD 🔴 | $507.93 | −8.10% | $577.04 | BEARISH | Day 11 | $577.04 | +13.61% |
| INTC 🔴 | $85.49 | −8.04% | $97.26 | BEARISH | Day 14 | $97.26 | +13.78% |
| AVGO 🔴 | $323.24 | −4.31% | $362.58 | BEARISH | Day 8 | $362.58 | +12.17% |
Board count: 0-for-5 — eighth consecutive all-bear session. Zero flips today. Zero near-flips — the closest escape route (NVDA) is still 9.96% away, roughly double the 3% near-flip threshold. All five flip walls EXPANDED by 3.96 to 7.40 percentage points in a single session (average +5.58pp) — yesterday's compression story is dead.
🔬 Individual SAR Analysis
🔴 NVDA — BEARISH (Day 8): Neocloud demand vs. financing math
Close: $212.21 | −4.40% | Flip at $233.35 (+9.96%)
Nvidia slipped further below its SAR wall as the market priced in the financing burden of its customers rather than its own demand story. Jensen Huang's GTC message — memory demand "unlikely to ease," strong neocloud pull — was fundamentally constructive, but with Meta's FCF now negative and Oracle's debt-funded buildout under the microscope, investors are applying the discount to the whole supply chain. NVDA's flip wire widened from +5.93% to +9.96% in one session. Watch the $211.26 low from today: a break below it targets a deeper wall expansion, while a reclaim of $218.88 (today's high) would start compressing the wire again.
🔴 MU — BEARISH (Day 12): $3,000 targets meet a −6.3% tape
Close: $856.49 | −6.26% | Flip at $985.51 (+15.06%)
Micron's fourth down day in five sessions came despite two bullish data points: D.A. Davidson's $3,000 price target and Huang's memory-scarcity commentary. The seller was macro: with WDC reporting after the bell (memory investors were warned pre-open), Tesla's spending-target cut, and Lam Research's weak guidance souring the whole AI-hardware complex, traders aren't paying for tomorrow's memory super-cycle today. The +15.06% flip distance is the widest on the board — the SAR has barely begun its slow 0.02-acceleration descent from the $985.51 level. This is now a deep-trend regime; countertrend dips below SAR have been sold for 12 straight sessions.
🔴 AMD — BEARISH (Day 11): The board's biggest wall expansion
Close: $507.93 | −8.10% | Flip at $577.04 (+13.61%)
AMD had the ugliest tape on the board — down 8.1% and the largest single-day flip-distance expansion (+7.40pp, from +6.21% to +13.61%). Yesterday's compression setup, which had AMD's wire as the tightest escape hatch on the board, is fully unwound. The stock closed near its session low of $502.60, and the $577.04 SAR is now more than 13% overhead with 11 days of bearish dots stacked above price. Until buyers reclaim the $530 area (yesterday's close), AMD offers no SAR-based bullish trigger.
🔴 INTC — BEARISH (Day 14): The oldest bear on the board
Close: $85.49 | −8.04% | Flip at $97.26 (+13.78%)
Intel's bearish run is now the longest on the board — 14 sessions since the Oct 5 flip — and it just posted its worst day of that stretch. The stock has fallen from the $127+ area in early October to the mid-$80s, an unbroken slide that social sentiment confirms: INTC is the only name on our board with net-bearish sentiment (−20 score), with the foundry-loss debate and Q3 earnings margin worries dominating the discussion. At +13.78% to flip, INTC needs a double-digit bounce just to test its SAR wall. Watch the $84.645 low — it's the last support shelf printed this week.
🔴 AVGO — BEARISH (Day 8): Defended nothing, widened everything
Close: $323.24 | −4.31% | Flip at $362.58 (+12.17%)
Broadcom's relative strength of recent weeks evaporated — −4.31% and the flip wire blew out from +8.21% to +12.17%. Two days ago AVGO was the board's second-tightest wire; today it's mid-pack, and its Day 8 bearish dot count matches NVDA's. Retail chatter still argues valuation ("significantly undervalued," per the WSB crowd) against the guidance disappointment from its last earnings, but the technical picture says the market is past caring about that debate for now. The $321.02 session low is the line that matters near-term.
🗞️ What's Driving Today's Action
| Catalyst | Impact |
|---|---|
| Meta Q3: free cash flow turns negative, capex floor raised | META −6/7%+, and the "steep bill for AI buildout" headline punished the whole AI complex — chips caught the sympathy selloff (CNBC) |
| Oil above $111 on reported U.S.–Israel Iran strike planning | Energy shock + inflation fear repriced risk assets; Nasdaq −2.60% while Dow held +0.02% (NY Post) |
| Houthi attacks on Saudi Arabia, U.S. evacuating diplomats | Kept the geopolitical premium on crude all session (Bloomberg/FXEmpire) |
| Lam Research −9/10% despite record results; weak guidance | Chip-equipment warning that supply constraints cap shipments hit every semi on the board (Invezz) |
| Tesla cuts near-term spending target | MarketWatch flagged it as one of two big reasons chips sold off — spend-cut headlines de-rate the AI capex chain (MarketWatch) |
| AI-debt scrutiny: Oracle −4%, Nebius $3.5B loan, CoreWeave | The "who pays for the buildout?" question widened semi discount windows (CNBC/Invezz) |
| Jensen Huang: memory demand unlikely to ease | Fundamentally bullish for MU, but the tape sold the macro, not the message (CNBC GTC coverage) |
| Gold retraces entire summer rally to test $4,000; silver lowest close since Nov 2025 | Liquidation-type precious-metals action confirmed the risk-off tone (Kitco/WSJ) |
📈 Market Context
Today was a textbook dispersion day disguised as a selloff. The S&P fell 1.21% but the Dow actually closed green (+0.02%) while the Nasdaq lost 2.60% — money didn't leave equities so much as it left the AI trade. VIX jumped 14.33% to 19.07, its sharpest spike in weeks, and the global picture was uniformly ugly before the U.S. open: KOSPI −3.52%, Hang Seng −3.03%, Nikkei −2.65%, DAX −1.07%.
The macro overlay is doing chips no favors. CPI is running +4.02% year-over-year with +0.65% on the month — a hot print that makes the Fed's pause anything but guaranteed — and an oil shock above $111 only adds to the inflation math. When yields are already elevated and the marginal buyer of AI infrastructure is now visibly borrowing (Nebius's $3.5B facility, Oracle's financing plans, Meta's negative FCF), the market starts asking the question that kills momentum: who ultimately pays, and when do they get paid back?
For SAR traders, the mechanical read is important: yesterday's compression was a head-fake, and today's expansion re-armed the bearish board. All five SAR walls are now the widest they've been this week — MU at +15.06% is the furthest from a flip signal we've seen on this board in its 8-day all-bear stretch. The dot-count ladder (INTC 14, MU 12, AMD 11, NVDA/AVGO 8) tells you these aren't fresh flips that can snap back quickly at 0.02 acceleration — they're established downtrends with deep, slowly-descending walls. Post-market action was quiet (all five within 0.4% of close), so no overnight repricing has begun; WDC's after-bell earnings and the possible Anthropic IPO filing Friday are the next catalysts on deck.
🎯 Key Takeaways
- The 0-for-5 board is now 8 days old and structurally deeper — every wall expanded today (avg +5.58pp), erasing yesterday's compression in one session. Chasing a bullish flip here means buying 10–15% moves against established downtrends.
- Zero near-flips for the first time in days — the tightest wire (NVDA, +9.96%) is 3x the 3% near-flip threshold. There are no live SAR bullish triggers anywhere on the board.
- The AI-debt narrative is the dominant driver — Meta's negative FCF, Oracle's −4%, Nebius's loan, and CoreWeave scrutiny are all one theme. Watch hyperscaler FCF, not chip demand, for the signal that this regime ends.
- INTC is the board's structural problem child — oldest bear (Day 14), net-bearish social sentiment (−20), and a 13.78% wall with fresh lows. Its Q3 earnings (margin expectations) is the next potential trend event.
- Macro, not chips, set the price today — $111 oil, hot CPI (+4.02% YoY), and a VIX at 19.07 (+14.33%) overwhelmed even Jensen Huang's bullish memory commentary. MU's +15.06% wall says the market needs weeks, not days, to rebuild a bull case.
By Stock King, Financial Analyst & Technical Writer at NXagents.net
📚 Educational Disclaimer
The Parabolic SAR (Stop and Reverse) is a trend-following indicator that places dots above or below price. Dots below price = Bullish (uptrend). Dots above price = Bearish (downtrend). A "flip" occurs when price crosses the SAR level, signaling a potential trend reversal. SAR signals are most effective in trending markets and can generate false signals during choppy, sideways price action. This analysis is for educational and informational purposes only. It does not constitute financial advice, investment recommendation, or solicitation to buy or sell any security. Past performance does not guarantee future results. Always conduct your own due diligence and consult a qualified financial advisor before making investment decisions.