How to Increase Walk-in Traffic to Your Restaurant in Canada (2026 Guide)


How to Increase Walk-in Traffic to Your Restaurant in Canada (2026 Guide)
Key Takeaways
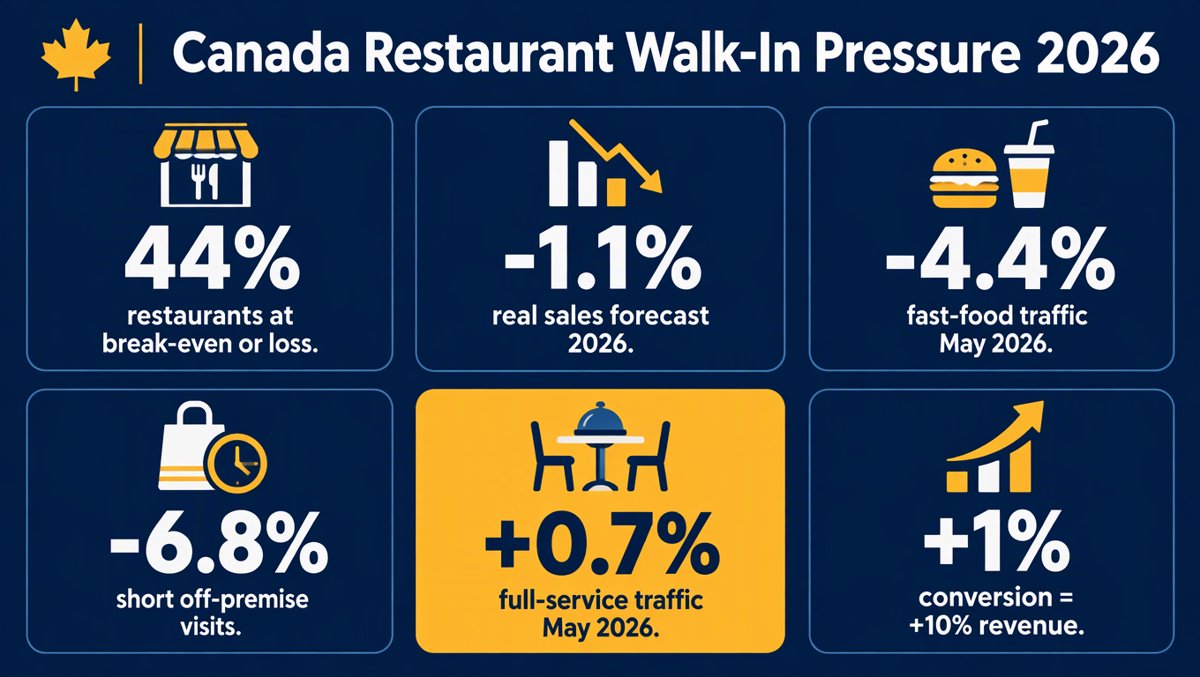
- 44% of Canadian restaurants were at break-even or losing money in Q4 2025 (up from 41% in June 2025), and real foodservice sales are forecast to fall 1.1% in 2026 (Restaurants Canada).[1]
- A 1% lift in conversion ≈ roughly 10% more revenue — conversion, not passing traffic, is the lever you control (Dor data via Restaurant Dive).[5]
- Fast-food traffic fell 4.4% year over year in May 2026 while full-service traffic rose 0.7% — same economy, opposite results (Placer.ai).[5]
- Restaurants that added online ordering saw a +18% average sales lift (TouchBistro 2026 survey of 600 operators).[8]
- Toronto case studies: C$500 → 37 walk-ins and C$1,000 → 173 walk-ins — implied cost of roughly C$6–14 per walk-in.[9]
- 1,500–2,500 net closures are expected in 2026, with insolvencies up ~7.5% in the first half of the year.[4]
The answer in 30 seconds: 44% of Canadian restaurants are at break-even or losing money, real sales are forecast to fall 1.1% in 2026, and the lever you still control is conversion — Dor's data shows a 1% lift in conversion ≈ +10% revenue. The playbook below turns passing traffic into paying guests with methods you can count: a 2–3-week door baseline, hourly staffing curves, conversion-window fixes, and channels ranked by cost per proven walk-in, not impressions.
Why walk-in traffic is the whole game in Canada right now
Canadian restaurants are paying more for food and labour, selling slightly less in real terms, and closing in the hundreds. 44% of Canadian restaurants were operating at a loss or breaking even in Restaurants Canada's Q4 2025 survey, up from 41% in June 2025, and the association forecasts real foodservice sales to fall 1.1% in 2026 after 2.4% real growth in 2025. [1]
The dollar totals hide the pain. Statistics Canada put food services and drinking places sales at $8.8 billion in February 2026 (+0.6% month over month) and $8.9 billion in July 2026 (+0.8%) — but full-service menu prices were running 7.8% higher than a year earlier. Nominal sales keep rising because prices do. More dollars, fewer plates. [2][3]
The closures followed. Dalhousie's Agri-Food Analytics Lab expects 1,500–2,500 net restaurant closures in 2026 (579 already tracked in the first half), revised down from a January forecast of roughly 4,000. Accommodation and food-service insolvencies hit 360 in the first half of 2026, about 7.5% more than a year earlier, with second-quarter filings up nearly 19%. [4]
Within that squeeze, quick-service took the worst hit: 77% of quick-service operators reported weaker-than-expected profitability, versus 58% of full-service operators. Food costs are a top concern for 88% and labour for 89%. [1]
Meanwhile the traffic itself is splitting. Placer.ai data shows fast-food traffic fell 4.4% year over year in May 2026 — the worst month of the year so far — with only February posting a gain in the first five months of 2026. But full-service traffic actually rose 0.7% in May, and short under-10-minute off-premise visits fell 6.8%. In Q2, Chipotle grew traffic 4.7% while McDonald's visits fell 4.5% — same category, same economy, opposite results. The brands winning are differentiating on food quality and experience, not price alone. [5]
Context for scale: IBISWorld puts Canadian full-service restaurants at roughly $48–50 billion in 2026 across 79,999 businesses (+1.1% from 2025) — the two IBISWorld pages list $47.7B and $50.3B, so treat it as a range — and fast food at $39.6B across 21,209 businesses. [6][7] The market is not shrinking; the money is moving to whoever converts the people already walking past.
What a walk-in is actually worth
The arithmetic that matters most is conversion — the share of people who enter and actually become a seated table or a paid ticket. A 1% increase in conversion rate can translate into roughly a 10% increase in revenue, per Dor's retail data. [5] When category traffic is falling 4.4%, you cannot always make more people walk by. You can make far more of the ones who do walk in become seated, served, and satisfied.
| Lever | The number | What it means for you |
|---|---|---|
| Conversion lift | +1% conversion ≈ +10% revenue | A greeter, faster seating, and a clearer menu beat more ad spend. |
| Online ordering | +18% average sales lift for full-service operators who added it | The most countable channel — orders arrive with receipts, not impressions. [8] |
| Case study: Simi African Foods (Toronto) | C$500 spend → 37 walk-ins, sold out a weekend at 3× usual sales | Implied cost ≈ C$13.50 per walk-in (our arithmetic from cited spend and count). [9] |
| Case study: World Soccer Party | C$1,000 → 173 walk-ins from 7 creators | Implied cost ≈ C$5.80 per walk-in. [9] |
| Beverage attach | 50–80% margins on specialty coffee and soft drinks | Every walk-in converted at the drink stage carries the ticket. [10] |
| Full-service prime-cost target | 60–65% of sales (food + fully loaded labour) | Traffic only pays if it lands inside this cost band. [11] |
The 5-step walk-in playbook
Step 1 — Baseline your door for 2–3 weeks before changing anything
Track entries for a few weeks. Learn your real average day, your true peaks, and your current conversion rate — most operators are surprised, because the hour they assumed was busiest often is not. [5] A simple people counter (Dor positions its thermal sensor as a peel-and-stick, no-wiring option) or even a host clicker during one shift per week gives you the count your POS cannot: the people who peeked at the wait, left ungreeted, or skipped a long-looking line. Your POS counts only guests who ordered. [5]
Step 2 — Schedule to the traffic curve, don't add hours
Plot traffic hour by hour across several weeks and build the schedule backward from the peaks. Move hours, do not add them. Understaffing during a peak is not a small miss — guests wait, walk out, and do not come back. When you can see the curve, you staff the rush before it hits and taper the slow stretches without growing the total labour budget. With labour a top concern for 89% of operators, this is where the money is. [1][5]
Step 3 — Fix conversion windows, not just covers
When traffic holds steady but conversion dips in a specific window, that is usually a service or seating bottleneck you can fix — a host at the door, faster seating, a clearer menu out front. [5] Capture rate is the diagnostic: entries versus sales by hour tells you whether a slow night was a demand problem (fewer people around — needs marketing) or an execution problem (plenty of people, but they did not come in or stay — needs a door and a host).
Step 4 — Test one change at a time, for 2–3 weeks
Adjust a shift, a greeter, or a promo — then compare traffic and conversion over the next 2–3 weeks. Keep what works. [5] When you run a promotion, read it this way: if traffic lifted 20% but sales moved 5%, the offer drew a crowd your team did not convert. If traffic never moved, the message did not land. Either way you get a clear answer instead of a guess. [5]
Step 5 — Rank every channel by cost per proven walk-in
At a 3–4% net margin, a C$300 ad spend has to produce several thousand dollars of sales to pay for itself — and an impression cannot prove it did. Ask every channel four questions: Can you show me the customers, not the audience? What did each one cost? Can I stop paying the moment it stops working? Who sent them, so I can book that person again? [9]
The one channel with a hard number behind it is online ordering: TouchBistro's 2026 survey of 600 Canadian full-service operators found restaurants that added online ordering saw an average 18% overall sales lift. [8] And when dine-in holds up while off-premise visits slide 6.8%, your in-person experience is the asset to defend — the experience, with cleanliness, attentive service, and value, ranks among the strongest drivers of restaurant choice in Restaurants Canada's Foodservice Facts 2026. [12]
How to increase walk-in traffic to a restaurant in Canada: the checklist
| # | Action | How to measure it |
|---|---|---|
| 1 | Count the door — baseline entries for 2–3 weeks | Entries/day, entries by hour, peak discovery |
| 2 | Compute conversion — orders ÷ entries, by window | Dips in a window = service or seating bottleneck |
| 3 | Move labour hours to the measured peaks — no net new hours | Labour % stays inside the 60–65% prime-cost band |
| 4 | Put a greeter and a clear menu at the door | Conversion lift — every 1% ≈ +10% revenue |
| 5 | Add online ordering and track it as its own channel | Target the +18% average lift; every order has a receipt |
| 6 | Run creator/local promos with walk-in counts | Cost per walk-in — benchmark ~C$6–14 from the Toronto cases |
| 7 | Protect the beverage attach — 50–80% margin drinks on every ticket | Beverage attach rate per converted guest |
🏁 THE VERDICT
In a year when 44% of Canadian restaurants sit at break-even and real sales fall 1.1%, the winner is whoever converts the traffic already walking past — a 1% conversion lift is worth roughly 10% more revenue.
The single next step: count your door for the next three weeks, find the one hour where conversion dips, and fix that hour first. Then rank every dollar of marketing by one number — what each walk-in cost you.

💬 Want the working version? Subscribe free — Saturday toolkit PDFs by email. Ask me anything about this playbook: Chat with Peter.
Informational content only. Thresholds, margins, and forecasts are cited estimates, not financial advice — verify against your own books and your accountant before acting.
Frequently Asked Questions
How do I measure my restaurant's walk-in traffic in Canada? Track entries separately from orders for 2–3 weeks. Your POS counts only guests who ordered — it cannot see people who peeked at the wait, left ungreeted, or skipped a long-looking line. A door counter (a peel-and-stick thermal sensor like Dor's, or a host clicker one shift per week) gives you the real count and your conversion rate by hour of day.
What conversion rate should a Canadian restaurant target? The lever is conversion itself: Dor data shows a 1% lift in conversion ≈ roughly 10% more revenue. Whether your baseline is 20% or 40%, a one-point lift — a greeter, faster seating, a clearer menu at the door — moves revenue more reliably than buying more impressions. The diagnostic: entries versus sales by hour. A dip in one window means a service or seating bottleneck in that window, not a demand problem.
How much does it cost to get one more walk-in? With countable channels you can compute it. Two Toronto cases: C$500 produced 37 walk-ins (≈C$13.50 each) and C$1,000 produced 173 walk-ins (≈C$5.80 each), both attributed to creator and local promos where the spend and the walk-in count were both tracked.[9] If a channel cannot show you the customer and what they cost, you cannot rank it.
Is online ordering worth adding to increase walk-in traffic? It does not increase walk-ins — it captures people who never walk in. TouchBistro's 2026 survey of 600 Canadian full-service operators found restaurants that added online ordering saw an average 18% overall sales lift.[8] Track it as its own channel with its own receipts, not as a traffic tactic.
Why did restaurant traffic fall in Canada in 2026? The split is the story. Fast-food traffic fell 4.4% year over year in May 2026 while full-service traffic rose 0.7% (Placer.ai).[5] In Q2, Chipotle grew traffic 4.7% while McDonald's visits fell 4.5% — same category, same economy, opposite results. The brands winning are differentiating on food quality and experience, not price alone.
📚 SOURCES
[1] Restaurants Canada, Q4 2025 survey (via Onlure, Oct 6 2026) — https://onlure.ca/blog/restaurant-margins-walk-ins-canada-2026 [2] Statistics Canada, Feb 2026 food services & drinking places sales ($8.8B, +0.6% m/m; menu prices +7.8% YoY) via Onlure, Oct 6 2026 — https://onlure.ca/blog/restaurant-margins-walk-ins-canada-2026 [3] Statistics Canada, July 2026 food services & drinking places sales ($8.9B, +0.8% m/m) — https://www150.statcan.gc.ca/n1/daily-quotidien/260928/dq260928b-eng.htm [4] Dalhousie Agri-Food Analytics Lab (via Retail Insider, Aug 2026) — 1,500–2,500 net closures 2026; 579 tracked H1 — https://onlure.ca/blog/restaurant-margins-walk-ins-canada-2026 [5] Dor / Placer.ai via Restaurant Dive (Jul 28 2026) — QSR traffic -4.4% May 2026; full-service +0.7%; Chipotle +4.7% vs McDonald's -4.5% Q2 2026; 1% conversion ≈ +10% revenue — https://www.getdor.com/blog/2026/07/28/restaurant-foot-traffic-2026/ [6] IBISWorld, Full-Service Restaurants in Canada — $47.7bn / $50.3bn 2026 (pages conflict; reported as range), 79,999 businesses — https://www.ibisworld.com/canada/number-of-businesses/full-service-restaurants/1677/ [7] IBISWorld, Fast Food Restaurants in Canada — $39.6bn 2026, 21,209 businesses — https://www.ibisworld.com/canada/market-size/fast-food-restaurants/1980/ [8] TouchBistro 2026 survey of 600 Canadian full-service operators — online ordering +18% average sales lift (via Onlure, Oct 6 2026) — https://onlure.ca/blog/restaurant-margins-walk-ins-canada-2026 [9] Onlure Toronto case studies — https://onlure.ca/blog/restaurant-margins-walk-ins-canada-2026 [10] TFI Canada, Maximizing Menu Profitability in Canadian Restaurants — https://www.tficanada.com/maximizing-menu-profitability-canadian-restaurants [11] Waitery (Canada), Restaurant margins in Canada 2026 — https://waitery.ca/resources/restaurant-profit-margin-canada/ [12] Restaurants Canada, Foodservice Facts 2026 — https://www.restaurantscanada.org/research/foodservice-facts-2026/